Zaawansowane wykresy
The various charts show an historical view of the market for a variety of metrics. This enables you to see at a glance the history for the various metrics for one or more selections.
You can have up to 3 separate sets on advanced charting, each set with its own configuration options. Each set can include from 1 to as many charts as you require, with a unique & completely customisable way of laying them out. Set 1 & 2 are floating windows, and can be launched by clicking on the launch chart icons of the respective selections in the grid or the ladder.
Set 3 are embedded in the ladder, and relate to the runner in that ladder. By selecting the Menu drabinki -> Układ drabiny -> Opcje wykresow, you can determine the chart placement in the ladder. There are 5 options for the embedded ladder chart placement Wylaczony, W kolumnie wykresu, Gora, Spod, Sam dół.
In the below image you can see one possible configuration of the W kolumnie wykresu setting.
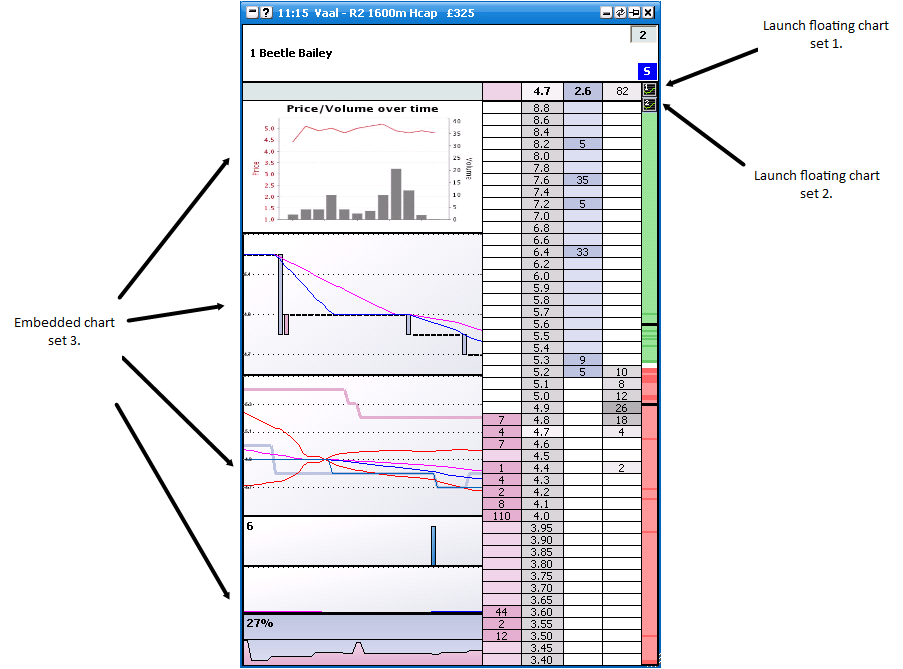
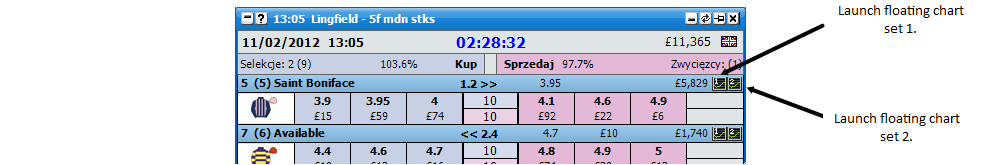
The floating chart sets can be launched from either the grid or the ladder by clicking on the respective launch Icons as shown above.
There are 3 defined sets of behaviour for the floating charts, which can be set from the Główne menu -> Opcje wykresow. These are….
Obecna selekcja - Up to one window of each floating chart set will be displayed. Whichever selection your mouse is currently over, the information for this runner will be displayed in the window.
Wielokrotna selekcja - Up to one window of each chat set per selection will be displayed. These are tied to the grid order in the application.
Wielokrotna selekcja drabinki - Up to one window of each chat set per selection will be displayed. These are tied to the ladder order in the application.
|
NB There is an option in the Menu drabinki called Use GlobalOrdering. If this option is switched on, the grid & other controls always track the ladder ordering. As such there is no difference between Wielokrotna selekcja & Wielokrotna selekcja drabinki in this mode.Charting Set Layout Options
Each charting set can be configured to display one or more charts as per your preferences. To configure the number of charts, the type of charts and the layout, right click on the respective chart to bring up the menu. When you first use each chart set, a single Line chart will display. To change this chart to one of the other chart types, select Ten wykres jest.. from the menu.
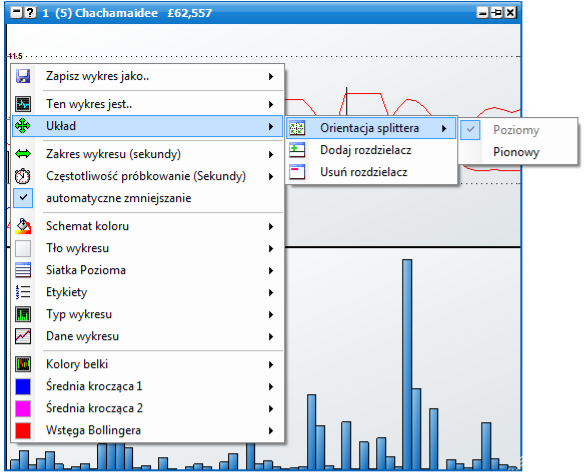
To add an additional chart, select Układ->Dodaj rozdzielacz from the menu. This will add a horizontal splitter to the chart set with an additional Line chart. Should you wish to change the splitters orientation to vertical, select Układ->Orientacja splittera->Pionowy from the menu.
Below you will see the menu for a floating 2-chart configuration.
Charting Saving / Loading
The option already exists in the application to save and load entire profiles, which remembers all settings including the charts for fast recall at a later date. In addition the application will always remember your current settings when you close down for your next use.
However a useful addition is you can also save & load your own customised individual charts. These charts include all settings for that particular chart. You can save, load and delete these custom charts using the Wczytaj niestandardowy wykres, Zapisz wykres jako.. and Usuń niestandardowy wykres options.
This is useful for copying charts between various profiles and sharing them with friends.
Other Common Menu Options
The following menu options apply to one or more of the various streaming charts.
Zakres wykresu (sekundy) - This is the time span that the chart data covers.
Częstotliwość próbkowanie (Sekundy) - This is how often the chart is updated. NOTE: Chart redraws are processor intensive. By default the chart sample rate is set a 1 second or more. Should you find application use sluggish, turn you sample rates down. {Higher number.}
automatyczne zmniejszanie - When checked the chart Y-Axis will auto shrink to the data within.
Schemat koloru - Sets the chart to one of the pre-defined colour schemes.
Tło wykresu - Sets the colours & gradient fill for the background of the chart.
Tło zewnętrzne - Sets the colours & gradient fill for the labels of the chart if the labels are not set to Etykiety->Etykiety wewnątrz.
Siatka Pozioma - Options for the Y Axis grid lines
Kolor - Grid line colour.
Maksimum linii - Maximum grid lines to show on the graph.
Typ linii - Off, Light Dash, Heavy Dash, Solid.
|
Etykiety - Options for the Y-Axis Labels
Kolor - Label text colour.
Lokalizacja - Which side of the chart the labels display. Off, Left, Right or Both.
Rozmiar czcionki - The font size of the labels.
Styl czcionki
Wytłuszczony
Normalny
kursywa
|
Etykiety wewnątrz - Set whether the labels display inside or outside the graph.
|
|
Chart Types
There are a number of differing chart types that you can utilise using the Ten wykres jest.. option from the menu. Each chart and its configuration options are listed below…
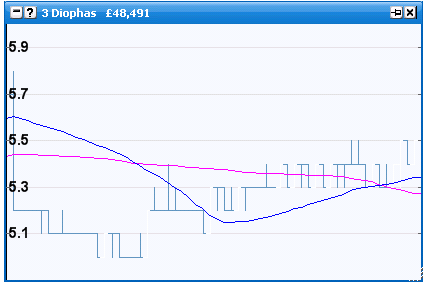
Świeca kursu OLHC
Japanese Candlesticks and OpenHighLowClose charts plot price data over a specified time period. Each shows the Opening, High, Low and Close based upon the user defined sample rate. Visually though they are slightly different in nature, with candle charts representing this data as Bars instead of lines. First we see an OLHC chart…
And here a Japanese Candlestick representation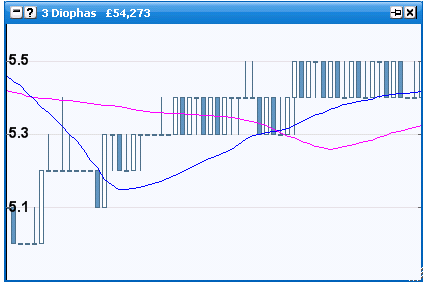
You can choose between either using the Chart Type option from the menu. You can also choose whether the chart plots on the back, lay or last traded price from the Chart Data menu option.
Further configuration options include allowing the user to change the bar colours and configuring 2 moving average line indicators, and Bollinger Band indicators.
Linia kursu
Price charts plot various price metrics over a specified time period. Various indicators can be optionally shown and their colours and settings can be user configured. These include Back, Lay and last traded prices, configuring 2 moving average line indicators, and Bollinger Band indicators.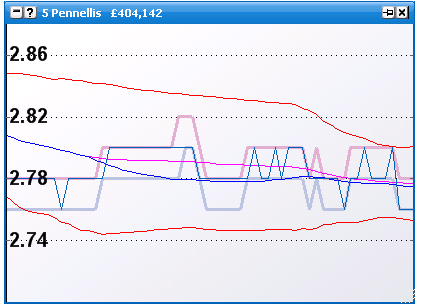
Ilosc pieniedzy
The weight of money graph shows the % weight of the prices to back vs the prices to lay. Configuration options include the back and lay fill colours and Line colour & thickness.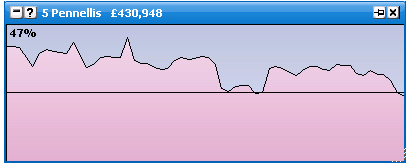
Wolumen
The traded volume chart shows recent amounts traded in the market. The highest volume bar for the chart is shown in the label at the top. Configuration options include the ability to set the bar colours.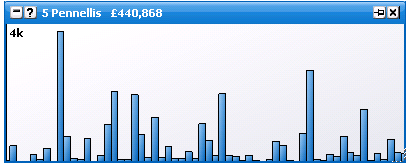
Średnia krocząca wolumenu transakcji
The traded volume moving average chart shows the moving averages of recent amounts traded in the market. These averages are configurable to a time period of your choosing.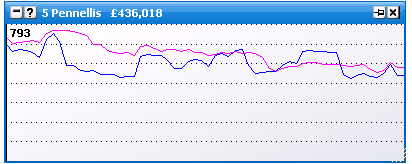
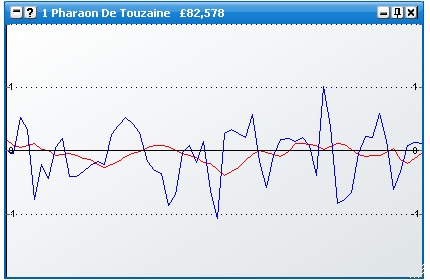
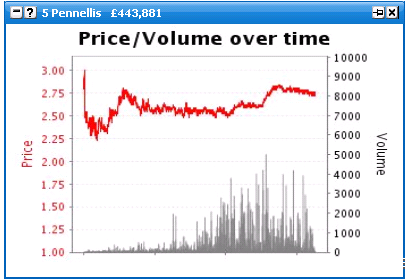
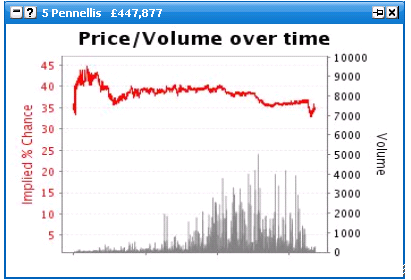
Betfair standartowy / Betfair odwrotny
These need no introduction, and are the standard charts used by Betfair.
You can view the full history of a selection by either price {standard} or implied probability. { Inverse } An Auto Refresh option is available and determines the auto update interval of these charts in the application.
MACD
See http://en.wikipedia.org/wiki/MACD